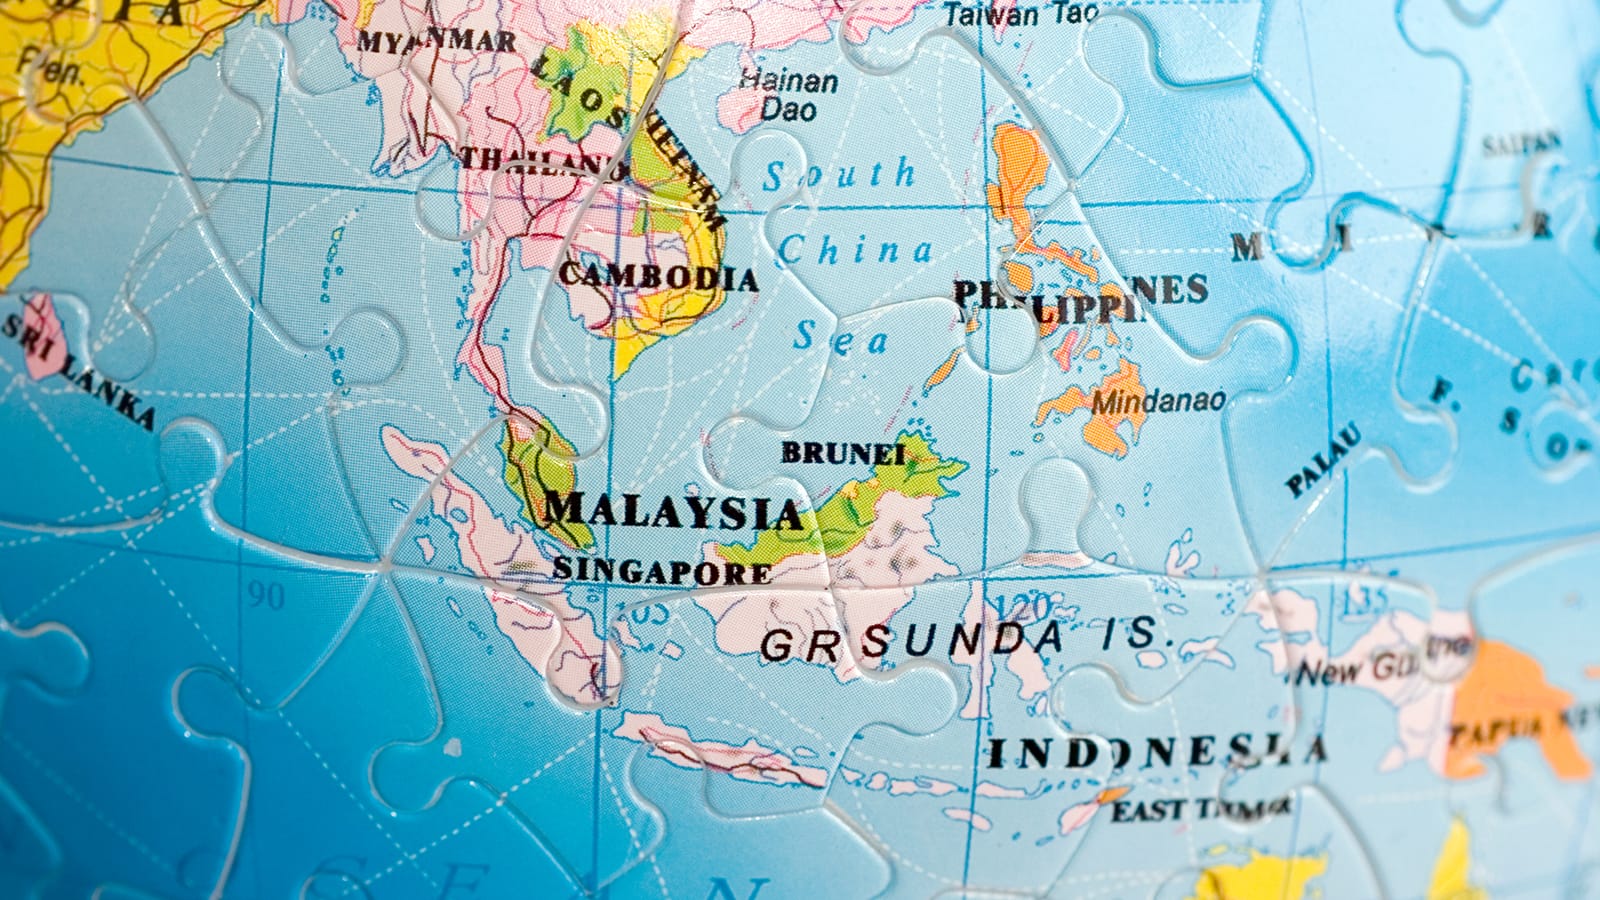
#1 ASEAN Total GDP vs Global GDP
Increasing Production in Southeast Asia
- Capturing a greater share of global trade flows - For instance, to attract more global production, Southeast Asia needs a rise in labour productivity.
- Riding the urbanization wave - By 2030, over 90 million people are expected to move to urban areas. It will be supporting the continuous increase of consuming class, which by the time could double to the amount of 263 million households. Keeping up with these adjustments would require an estimated $US 7 trillion investment on infrastructure, housing and commercial space.
- Deploying disruptive technologies - Mobile Internet, big data, Internet of things, cloud and automation of knowledge work are five technologies listed as major improvements in modernizing sectors and driving productivity across Southeast Asia.
#2 Annual Real GDP Growth
“Developing Asia continues to drive the global economy even as the region adjusts to a more consumption-driven economy in the People’s Republic of China (PRC) and looming global risks. While uncertain policy changes in advanced economies do pose a risk to the outlook, we feel that most economies are well positioned to weather potential short-term shocks.”
| Country | Estimates and latest projections Year-over-year change / % | ||
|---|---|---|---|
| 2016 | 2017 | 2018 | |
| Vietnam | 6.2 | 6.3 | 6.3 |
| Philippines | 6.9 | 6.6 | 6.7 |
| Indonesia | 5.0 | 5.2 | 5.3 |
| Malaysia | 4.2 | 5.4 | 4.8 |
| Myanmar | 6.1 | 7.2 | 7.6 |
| Thailand | 3.2 | 3.7 | 3.5 |
| Singapore | 2.0 | 2.5 | 2.6 |
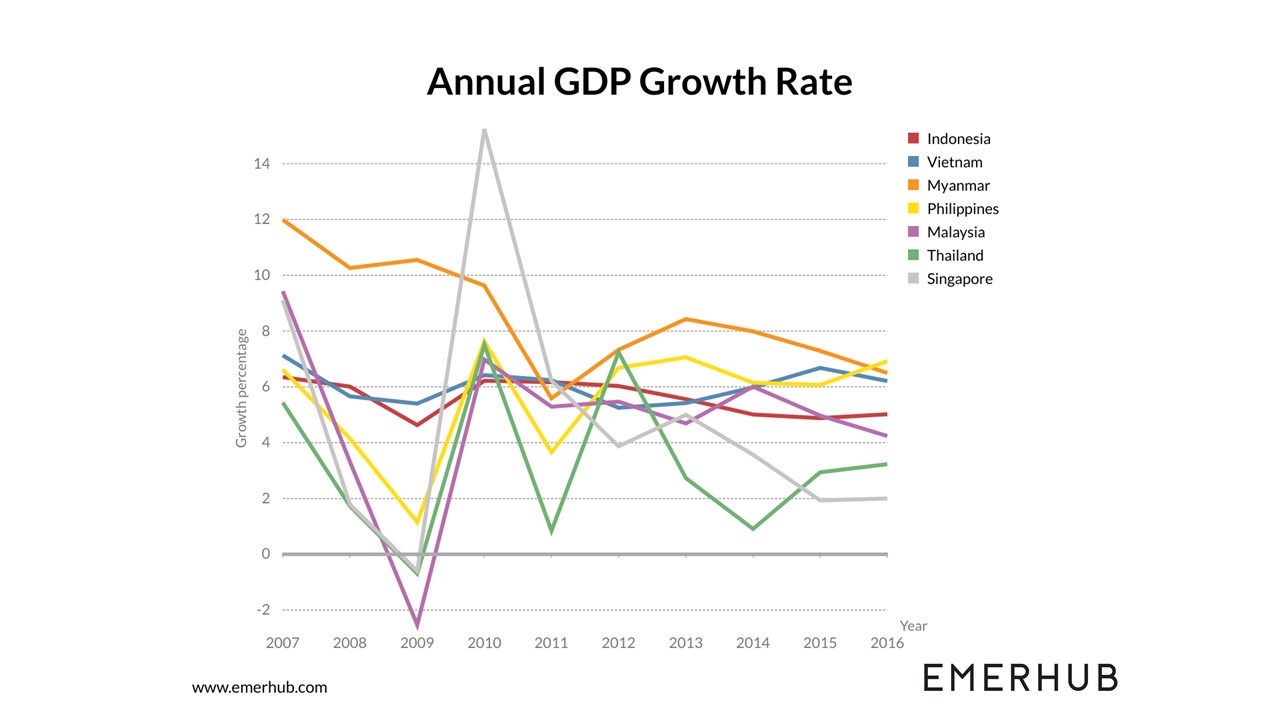
Indonesia GDP Growth
- Investments
- Exports
Vietnam GDP Growth
- Manufacturing – 12.8% rise through September from a year earlier
- Exports -19.8% increase with a trade deficit $US 442.00 million at the time
- Disbursed Foreign Direct Investment – Rising 13.4% up to $US 12.5 billion. Leading to pledged foreign direct investment increasing to 34.3%
- Consumer prices - Rising 3.4% in September compared to year earlier
The Philippines GDP Growth
- Manufacturing
- Trade
- Real Estate
- Renting
- Business Activities
- Household final consumption expenditure
- Durable equipment
- Government final consumption expenditure
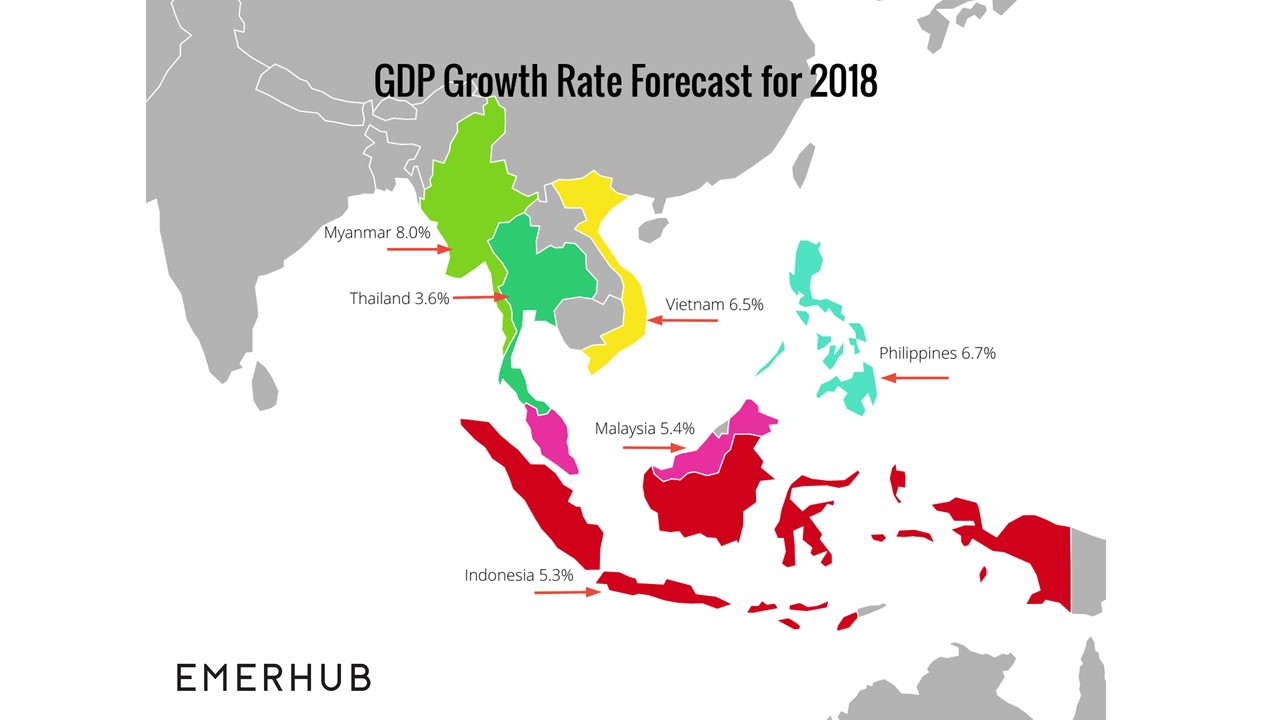
#3 GDP Growth Rate Forecast 2018
- Vital labour markets
- Active infrastructure spending
- Strong global demand
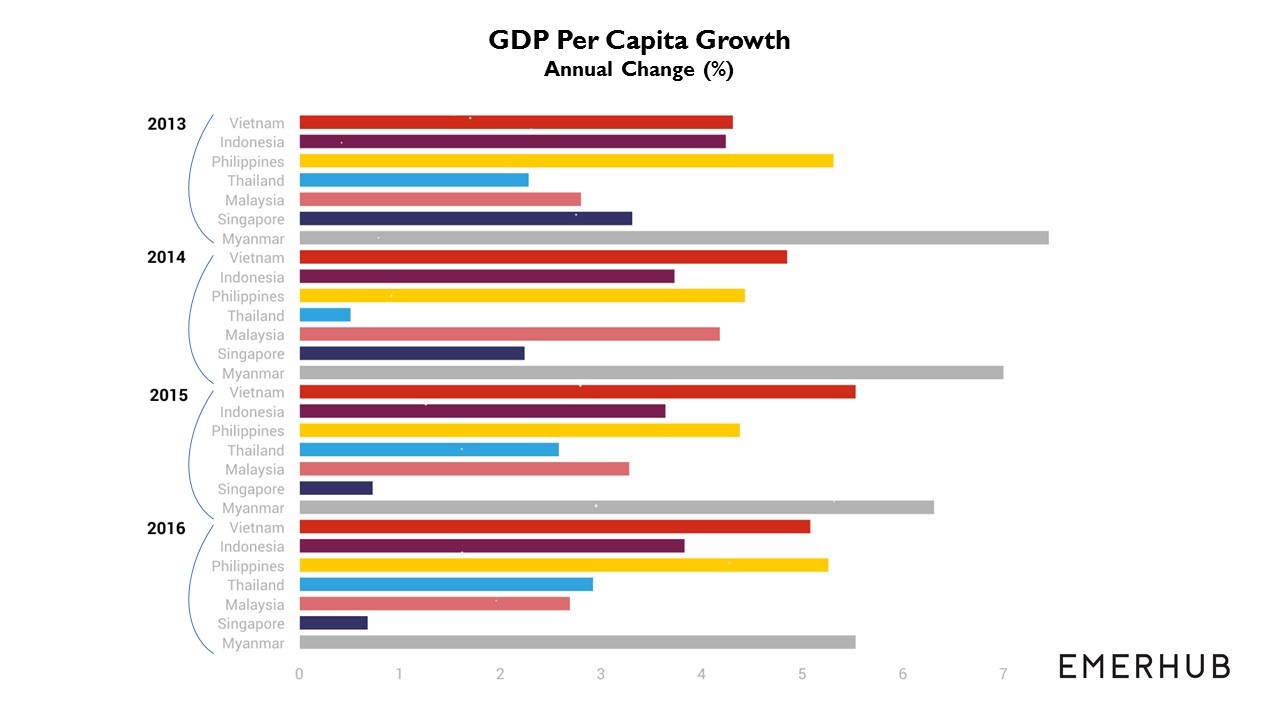
#4 GDP Per Capita and Growth
#5 Consumer Price Index and Inflation
| Country | Latest Consumer Price Index (CPI) / Index Points | GDP Growth Rate / % |
|---|---|---|
| Myanmar | 226 / August 2016 | 5.53 |
| Vietnam | 107.41 / November 2017 | 5.08 |
| Indonesia | 130 / November 2017 | 3.83 |
| Philippines | 151 / November 2017 | 5.26 |
| Cambodia | 169 / March 2017 | 5.22 |
| Malaysia | 120 / October 2017 | 2.69 |
| Thailand | 101 / November 2017 | 2.92 |
| Singapore | 99.27 / October 2017 | 0.68 |
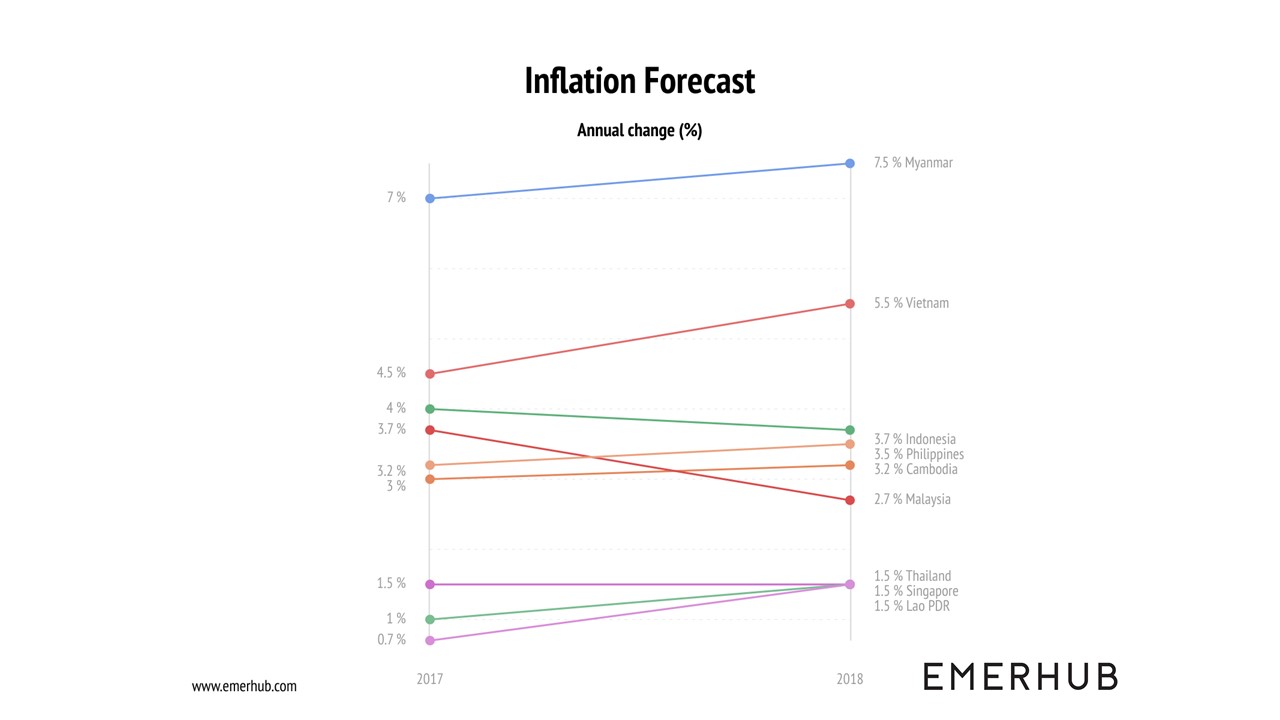
- Import prices
- Expectations of the public
- Capacity pressures in the domestic economy
#6 International Rating Outlook Comparison
| Country | Previous Investment Grade | Investment grade in 2017 |
|---|---|---|
| Philippines | BBB- | BBB |
| Indonesia | BBB- | BBB |
“This upgrade will become a good capital for Indonesia in entering 2018 to attract more foreign and domestic investment, both in real sectors and portfolio.”
- The focus of the government’s policy framework on macroeconomic stability
- The improvement in external buffers (including foreign-exchange reserves)
#7 Population and Growth
Customer Behaviour in Southeast Asia
| Jakarta | Bangkok | Kuala Lumpur | Ho Chi Minh City | Manila | Hanoi | Surabaya | |
|---|---|---|---|---|---|---|---|
| Fashion | 75.5 | 150.5 | 150.5 | 150.5 | 150.5 | 75.5 | 75.5 |
| Consumer Electronics | 150.5 | 250.5 | 400.5 | 150.5 | 400.5 | 150.5 | 75.5 |
| Home & Living | 150.5 | 400.5 | 250.5 | 250.5 | 250.5 | 400.5 | 150.5 |
| Entertainment | 75.5 | 150.5 | 150.5 | 150.5 | 150.5 | 75.5 | 75.5 |
| Health, Beauty & Wellness | 75.5 | 250.5 | 250.5 | 150.5 | 150.5 | 75.5 | 75.5 |
| Cuisine, Food & Catering | 75.5 | 150.5 | 150.5 | 150.5 | 150.5 | 75.5 | 75.5 |
| Financial Services | 150.5 | 600.5 | 400.5 | 250.5 | 400.5 | 150.5 | 150.5 |
| Education | 150.5 | 400.5 | 400.5 | 150.5 | 600.5 | 150.5 | 150.5 |
| Travel & Leisure | 250.5 | 400.5 | 850.5 | 250.5 | 600.5 | 150.5 | 250.5 |
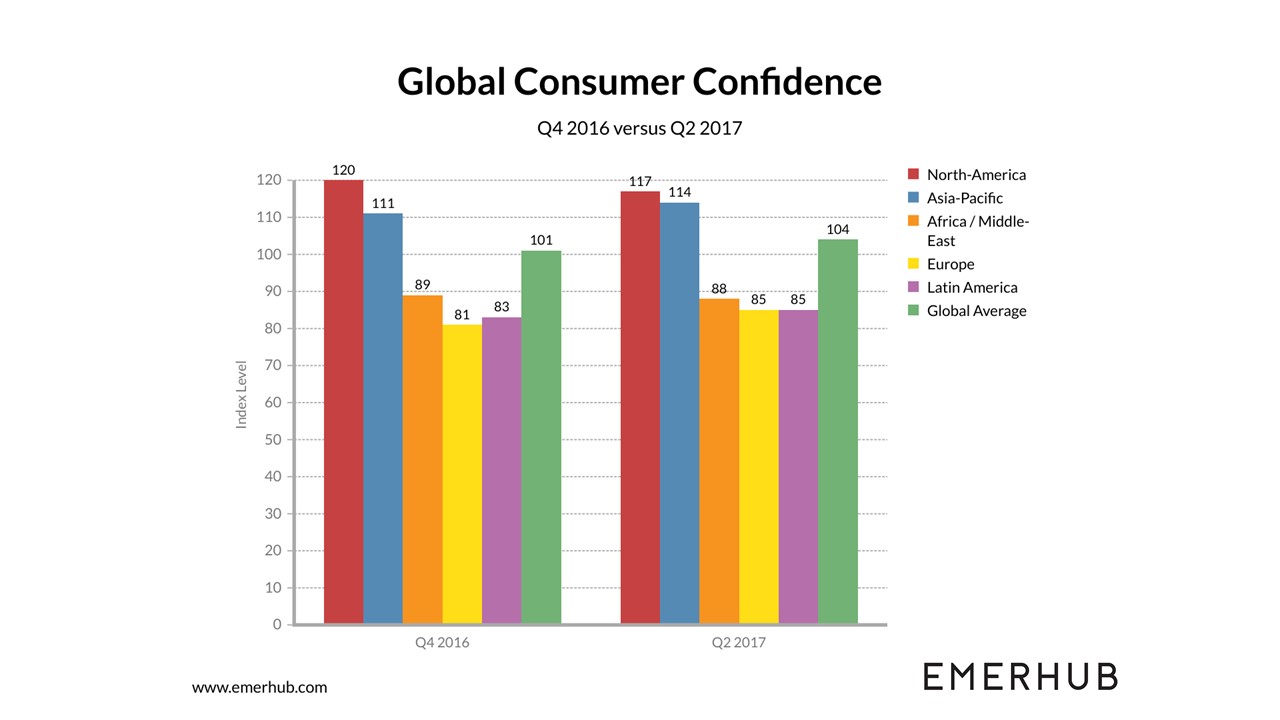
#8 Consumer Confidence Index
| H1 2017 Current Status | Change from last half | |||
|---|---|---|---|---|
| Asia Pacific | 66.9 | Optimistic | 4.2 | Stable + |
| Korea | 78.0 | Very Optimistic | 46.7 | Extreme Improvement |
| Singapore | 45.4 | Neutral - | 15.4 | Significant Improvement |
| Malaysia | 42.3 | Neutral - | 11.1 | Significant Improvement |
| China | 88.2 | Very Optimistic | 7.4 | Some Improvement |
| Bangladesh | 89.4 | Very Optimistic | 6.6 | Some Improvement |
| Hong Kong | 47.0 | Neutral - | 4.8 | Stable + |
| Taiwan | 38.3 | Pessimistic | 4.1 | Stable + |
| Indonesia | 74.8 | Optimistic | 4.0 | Stable + |
| Australia | 49.2 | Neutral - | 2.7 | Stable + |
| Japan | 44.4 | Neutral - | 1.4 | Stable + |
| Cambodia | 93.1 | Extremely Optimistic | -0.7 | Stable - |
| Vietnam | 90.8 | Extremely Optimistic | -1.5 | Stable - |
| New Zealand | 60.5 | Optimistic | -1.7 | Stable - |
| Sri Lanka | 38.2 | Pessimistic | -2.0 | Stable - |
| Philippines | 88.8 | Very Optimistic | -2.7 | Stable - |
| Thailand | 63.9 | Optimistic | -4.4 | Stable - |
| Myanmar | 86.8 | Very Optimistic | -6.0 | Some Deterioration |
| India | 86.0 | Very Optimistic | -9.3 | Some Deterioration |
Choosing Consumer Markets
"While Asean has been enjoying economic recognition in recent years, businesses tend to view it as a single entity and surprisingly, little is known about the many cities and regions that make up the archipelago. It's time for companies to look beyond mega-cities to see the growth opportunity hotspots within middleweight regions."